


Cognos PowerPlay Transformer - Models and Cubes
PowerPlay Transformer is a Cognos component used to define OLAP cubes structure and data (in PowerPlay models) and build the multidimensional analysis cubes called PowerCubes.
A PowerCube contains calculated, summarized data organized into dimensions and measures and can be viewed and analysed in the PowerPlay Web Explorer, PowerPlay client for Windows, PowerPlay for Excel or Cognos 8 BI. PowerCubes provide secure and fast data access.
Keep in mind that Cognos cubes are static and building a PowerCube is a repetitive process (cubes may be refreshed every day, every month or even once a year).
The PowerCubes can be accessed and used both on-line (PowerPlay Web & Cognos 8) and off-line (PowerPlay Client).
Main PowerPlay Transformer features:
- Advanced modelling capabilities
- Leverages aggregate and fact tables
- Intergation of the query data into the model
- The models are defined by dimension structures and measures which can be easily customized
- No custom programming required
- Time periods are handled in a specific way which makes data delivery easy
- High flexibilty and portability
PowerPlay cubes modeling and development process
The application development process in Cognos PowerPlay Transformer usually contains the following steps:
- Gather business users requirements
- Create a Model Plan which will include design and data requirements for the model and decide on the cube distribution methodology
- Select measures
- Plan dimensions and levels
- Design and develop the PowerPlay model in Transformer
- Create PowerPlay cubes and distribute them to the end users
- Analyze and explore the cube data using PowerPlay
A Transformer Model can be also created using a wizard with AutoDesign function or manually. We strongly recommend to avoid the AutoDesign function as in most cases it does not provide the results expected.
PowerPlay Transformer application
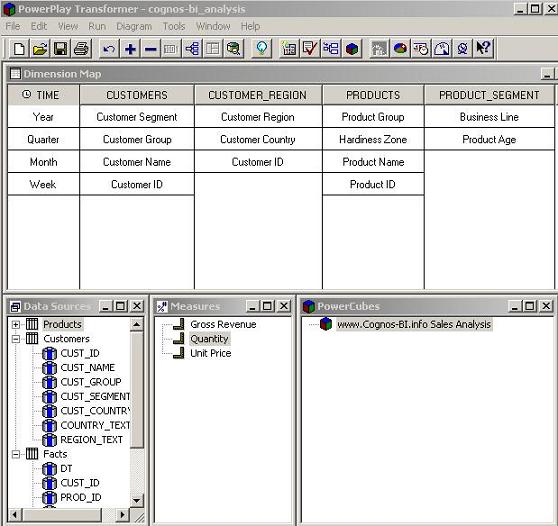
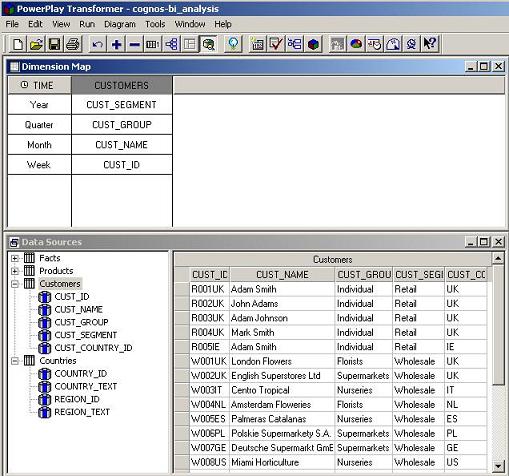
The default Cognos PowerPlay transformer window is composed of the following windows depicted on the the screenshots below.
Building a PowerPlay model involves designating columns in the source files as measures and dimensions&levels.
Cognos Powerplay Transformer model for the palm nursery business scenario:
Cognos PowerPlay Transformer Guide - data sources
PowerPlay Transformer is supplied with the source data through the data definitions managed in a Data Sources window.
Source data typically comes from a data warehouse, sometimes from production ERP system and in many cases includes multiple sources in order to deliver information required by the model.
Source data typically comes from a data warehouse, sometimes from production ERP system and in many cases includes multiple sources in order to deliver information required by the model.
Data sources recommendations
PowerPlay Transformer uses the following data types to populate dimensions, levels, categories and measures:
Cognos Powerplay Transformer - multiple data sources in a model with the data source definition:
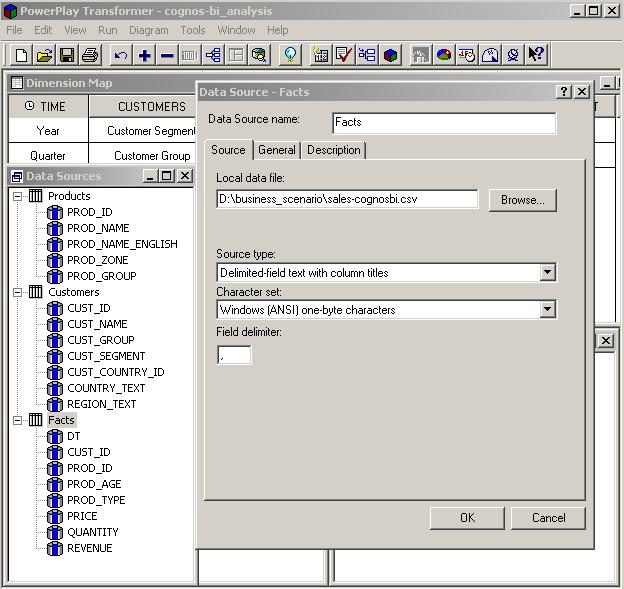
The data source properties window also allows users to choose the datasource type, point to the right file or database server and set up a number of processing options, like: define timing, uniqueness verification, specify number separators and indicate current period in the time dimension.
We will get into more details on that options later on in this tutorial.
Supported Data Sources by Cognos Transformer
Cognos PowerPlay Transformer Guide - Time dimension
In this lesson we will create the time dimension and time levels in our sample Palm Nursery model. We will group the data by year in the highest hierarchy level and the most detailed level in the time dimension will be a week. The time source data is in the DT column in the model.
Time dimension
Time dimension is a special type of dimension. Cognos provides an automatic support for handling time dimensions which is working very well.
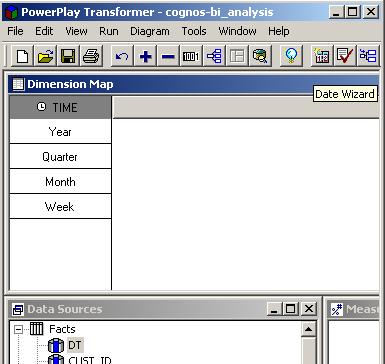
Go to Tools -> Date wizard (or use a date wizard icon located in the toolbar) and follow the wizard steps (values entered in our example in blue):
Go to Tools -> Date wizard (or use a date wizard icon located in the toolbar) and follow the wizard steps (values entered in our example in blue):
We can see a new time dimension in the Dimension Map of the model:
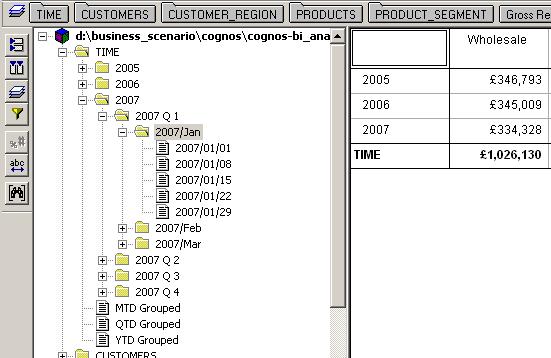
The time dimension levels in the PowerCube are depicted below:
Cognos PowerPlay Transformer Guide - Create Customer dimensions
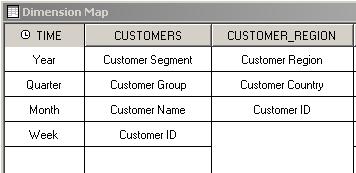
In this lesson we will create two dimensions: Customers and Customer Region. Each of the dimensions will have its own levels and categories and a single drill-down path.
The Customers dimension will have the following hierarchy:
Customer Segment -> Customer Group -> Customer Name -> Customer ID
And the Customer_Region dimension will have the following hierarchy:
Customer Region -> Customer Country -> Customer ID
It is a good practice to have a look at source data in the Data Source viewer and check if all the columns are displayed correctly before starting building the dimensions.
Follow the steps below to add a new dimension:
Customers dimension with the source data preview:
But at this stage we don't want to have Customers grouped by Region, Country and then by Segment becuase it would be not intuitive for the end users. We will create two separate dimensions for customers instead, to be able to analyze the data in a more user-friendly way.
Customer regions dimension:
PowerPlay Transformer Guide - Products dimension
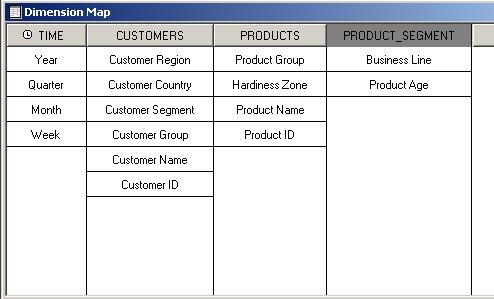
In this lesson we will create two additional dimensions: Product and Product Segment.
The dimensions will have the following hierarchy:
The dimensions will have the following hierarchy:
Each of the dimensions will have its own levels and categories and a drill-down path.
The products dimensions creation process
The Dimensions Map after adding the products dimensions looks like depicted below:
Define measures in the PowerPlay Transformer Model
After having all the dimension defined, we can proceed and create measures. When all dimensions and measures are set up, we will generate PowerCubes and open it in PowerPlay.
Measures are numerical figures and come from the fact table.
To add measures to the model, follow the instructions below:
Measures are numerical figures and come from the fact table.
To add measures to the model, follow the instructions below:
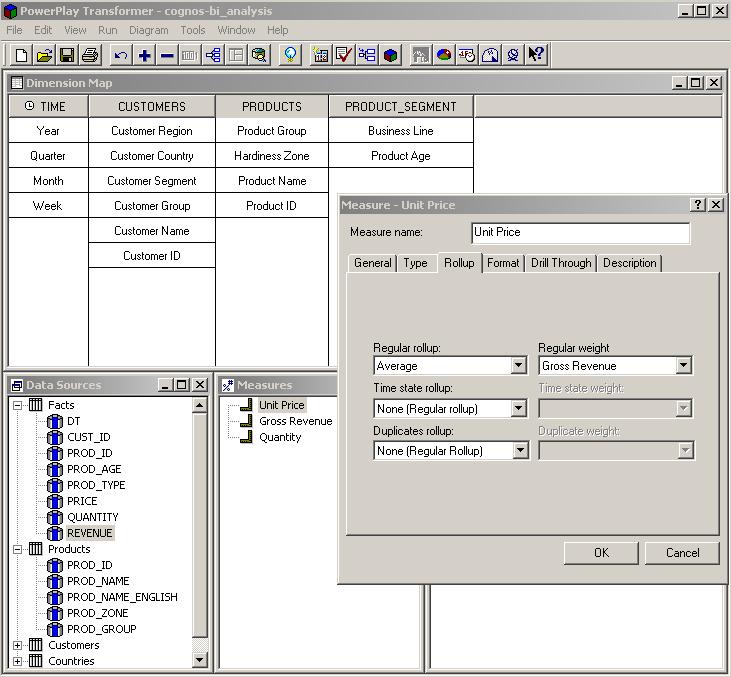
We also do not want to summarize the Unit Price measure because it does not make any business sense. To change the grouping calculation, go toRollup tab and choose Average and set Regular Weight to Gross Revenue .
Measure properties for Unit price :
Define an output PowerCube
The final model structure is shown below:
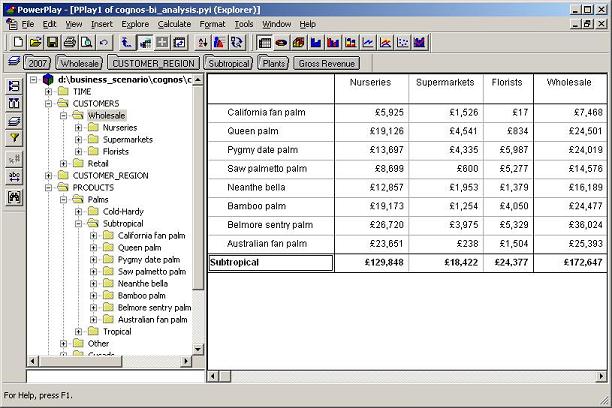
The Cognos OLAP cube created from the model illustrated above:
Measures allocation
Measures Allocation is a techique that allows comparing data in a report even though it is grouped on a different level of detail.
Usually it is required to perform allocation when part of the data is available only on a higher detail level than other data.
In real-life, the measures that usually need to be allocated are fixed costs, forecasts, budget plan, discounts, rebates, customer bonus. This is because in most cases those figures are calculated on a monthly (for example COSTS), quarterly (CUSTOMER BONUS) or yearly (BUDGET) basis and very often the SALES reports are generated on a daily basis.
It is also very important to remember that in some business cases allocation is logically inappropriate and may not make any sense.
There are two ways of implementing allocation:
Measures allocation real-life example in Cognos
In the following example we will analyze revenue, constant costs and variable costs. Our goal is to be able to compare revenue to fixed and variable costs in all the time dimension levels available.
We will analyze the following measures from our tutorial business scenario:
We will analyze the following measures from our tutorial business scenario:
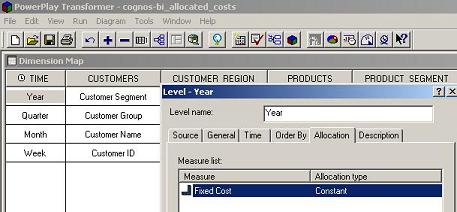
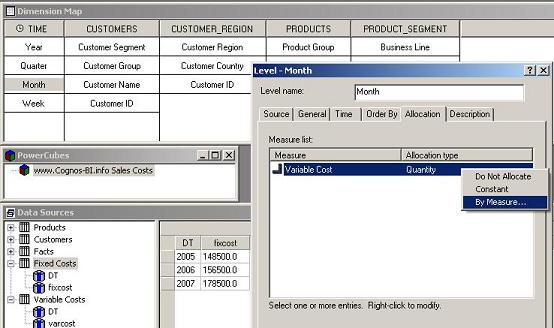
We will perform a constant value allocation to the FIXED COSTS in a YEAR dimension and dynamic allocation to the VARIABLE COSTS in a MONTH dimension (the allocation key is QUANTITY).
To allocate a measure in PowerPlay Transformer go to a dimension level properties to the allocation tab and choose the corresponding option.
Fixed measure allocation:
Measure allocation by QUANTITY:
We see below that fixed costs have been allocated in a constant fashion:
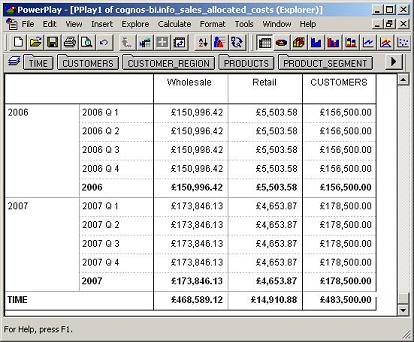
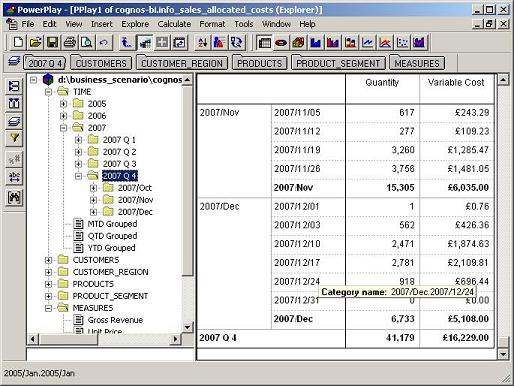
Variable costs allocated dynamically by quantity:
Categories:
Cognos Transformer
,
Cognos Tutorial
