Showing posts with label Cognos connection. Show all posts

Linking IBM Cognos Portal Pages through Prompts


In this month’s Tech Tip we will extend the capability introduced in last month’s article “Creating IBM Cognos Portal Pages” by linking various portal pages in Cognos Connection dashboard applications. To demonstrate this technique, we will explain how to pass your prompt selections from one dashboard portlet to other report portlets within the same dashboard page.

Create the main portal tab

The first step in enabling this functionality is to fuse all the different dashboard pieces together by creating another, master dashboard page that will encapsulate two things:
  1. The prompt.
  2. The two report outputs.
To do this, start by navigating to the “Global Filters” folder, created in the previous article, in Cognos Connection and click the New Page button.
Name the page “Returns Analysis Dashboard” and click Next.
This time around, our page will have two columns, so we will have to select the appropriate radio button in the Number of columns: section at the top. Then, using the Columns width: drop-downs, set the left column to a width of 20% and the right column to 80%.
Click the Add… link in the left column and add a Cognos Viewer object just as we did in the previous step.
Then, in the right column, add a Multi-page object from the Dashboard entries.
Your portal page should now be laid out like the image below. If this is the case, click Finish.
From Cognos Connection, click the “Returns Analysis Dashboard” page and click the properties icon of the left
column.
Just like we did in Step 2, click the Select an entry… link and navigate to the “Prompt Report” (inside the “Global Filters” folder). Then, in the report’s properties, set it to communicate using the “promptChannel” channel.
Click OK twice.
Now click the properties button of the right column. Click the Select an entry… link and navigate to the “Detail Pages” folder as shown below.
Click OK.
The prompt and reports are displayed side-by-side.
Test out work by making a selection in the prompt.
To create a new tab in Cognos Connection using your new portal page, click the Add to my portal link (circled in red below).

Dynamic Dashboards: Filtering and Drill-Down within IBM Cognos Portlets


A request we often get is to build more dynamic dashboards and reports. This can be accomplished by a combination of Report Studio prompt reports, portlets, drill-up/drill-down and filtering. The key to this interactivity is communication between IBM Cognos portlets and channels. Utilizing channels allows us to create dynamic filtering and drilling capability. This article will explain the basics of using portlets and channels and provide a sample of how to create a dynamic dashboard.
Note: The drill-up and drill-down between portlets only works with multidimensional data source viewer portlets on the same page.

Enabling Communication of Portlets Using Channel Names

If you want to set up communication between specific portlets within a page you will need to set up a channel name. Only the portlets that share the same channel name can interact with each other.
Note: Channel names can contain only letters, numbers, and underscore (_) characters, and can not contain any spaces. For example: Cognos, CognosPortlets,Cognos_Portlets.

Enable Sharing of Drill-Up and Drill-Down Actions

You can enable sharing of drill-up and drill-down actions between reports that are based on a dimensionally modeled data source. A drill action on an item in one report causes the same action in an associated report if the report is on the same page and contains the same data item.
This functionality is not supported for dashboards with multiple tabs. However, a single page with drill-up and drill-down actions enabled can be embedded into a dashboard as one of the tabs.

How to Create a Dashboard Portal

Goal: Create a single Cognos dashboard portal page with three Cognos portlets (three different Report Studio reports, one for each portlet), all communicating with each other in a dynamic fashion.
To accomplish this goal, we’ll need to create the following assets:
Cognos Report Studio Prompt Report – Create a prompt report in order to allow communication and filtering of reports between the Cognos portlets. This report will need an action button for Finish. This prompt report will display in one Cognos Viewer portlet.
Cognos Report Studio Chart Report – Add detail filters using the exact same prompt names as in the prompt report. The report will be assigned to one Cognos Viewer portlet.
Cognos Studio Detail Report – Add detail filters using the exact same prompt names as in the prompt report. The report will be assigned to one Cognos Viewer portlet.
Cognos Portal Page – Configure the page for two columns at 20% and 80%. In the second column (80%) you will have two IBM Cognos Viewers assigned (see screenshot below).
The first column will display the Cognos prompt report.
The second column will display the chart report, as well as the detail report

Step-by-Step Instructions:

Step 1: Assign reports to the Cognos portlets.
With our portal page created we need to select the reports that we want displayed in each of the three portlets. Select the Edit icon (highlighted in red below) on each of the Cognos Viewer portlets.

Step 2: Select the report for each Cognos portlet.
Click Entry (highlighted in red below) to choose the appropriate report. In our example, we will set the prompt report to be in the left-most portlet. We will select the chart report for the upper right portlet and our detail report as the lower right portlet.

Step 3: Setting the report properties.
Report settings need to be assigned to all three Cognos reports (prompt, chart and detail) in the Cognos portlet settings.
Let’s first assign our setting for the Cognos portlet containing the prompt report. Under Portlet Communication Options set the following (as shown below):
Prompt values:
Check the box next to Communicate with other portlets.
Select the radio button Portlets using channel:
Type in ProductChannel
Drill down and drill up:
Check the box next to Communicate with other portlets on this page.
Select the radio button next to Portlets using channel:
Type in ProductChannel.
Next, let’s assign our setting for the Cognos portlets containing the chart and detail report.
Enter ProductChannel as the Channel (as shown below).
Now the chart and the detail report can communicate with each other for drill-up and drill-down capability and dynamic filtering.
Note: The prompt report does not need the channel name as it will not be a recipient of any data from the other portlets.

Creating IBM Cognos Portal Pages


Overview:

This month’s Tech Tip article is a two part article that will review the implementation of global filters in Cognos Connection dashboard applications. To demonstrate this technique, we will explain how to pass your prompt selections from one dashboard portlet to other report portlets within the same dashboard page.
In an effort to facilitate the recreation of the samples provided in this article, all examples were written using the “GO Sales (query)” sample package (provided with the default Cognos sample pack) and have been broken down to two simple steps:
  1. Creating the Report Studio prompts and parameterized reports.
  2. Creating pages in Cognos Connection.

Step 1: Create the reports in IBM Cognos Report Studio

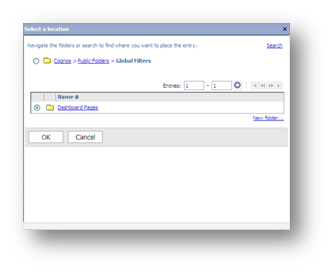
Before creating the reports, we must create folders in Cognos Connection to hold our reports and portal pages. In “Public Folders”, create a new folder called “Global Filters”. Then, within the “Global Filters” folder create another new folder called “Dashboard Pages”.
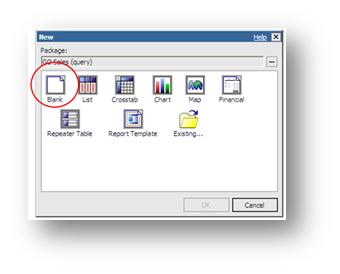
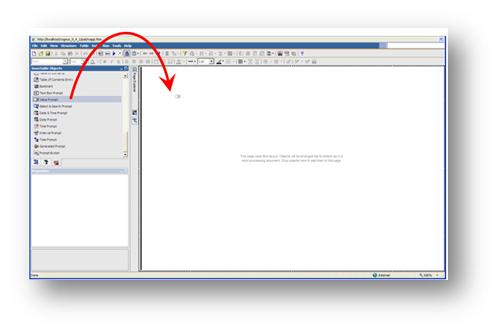
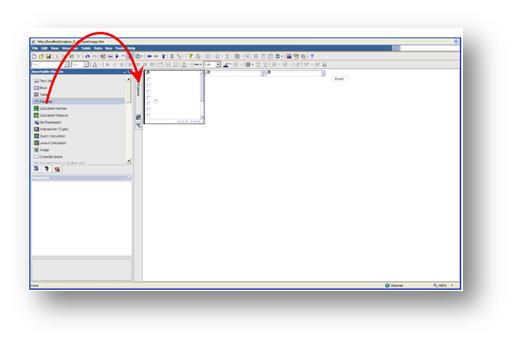
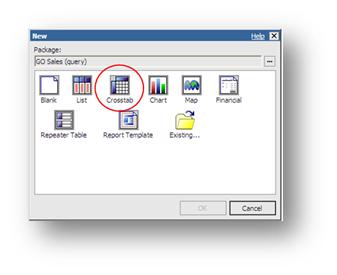
We are now ready to create the reports. We will begin by creating the prompt page that will drive the other report items contained on the dashboard page. To do this, launch Report Studio, create a new report and select the Blank template as shown in the image below.
We are now ready to start creating the prompt page. To do this, begin by going to the Toolbox tab of the Insertable Objects pane and drag a Value Prompt object onto the page. This will trigger the Prompt Wizard.
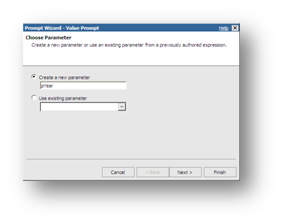
Create the prompt using the following steps:
  1. Create a new parameter name called “pYear” and click Next.
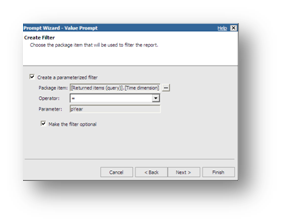
  2. Create the following OPTIONAL parameterized filter:
    Package item: “[Sales (query)].[Time dimension].[Year]“.
    Operator: “=”.
    Parameter: “pYear”.
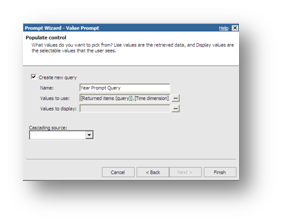
  3. Create a new query named “Year Prompt Query” with the following values:
    Value to use: “[Sales (query)].[Time dimension].[Year]“.
Click Finish.
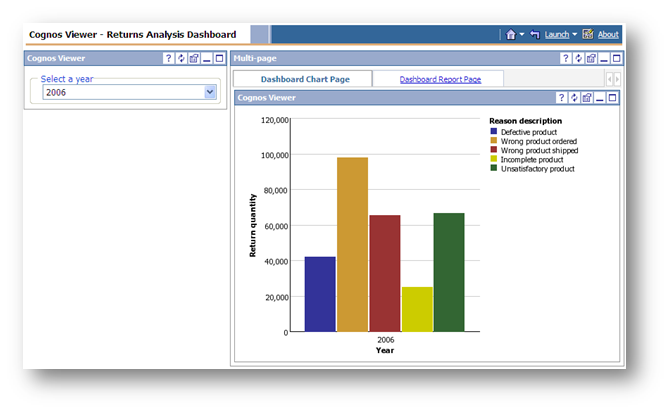
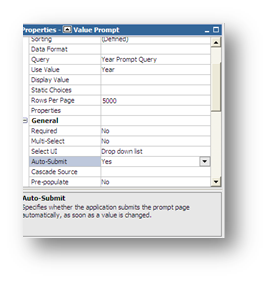
Finally, to allow our dashboard users to submit their prompt selections, we will change the prompt’sAuto-Submit property to Yes to automatically refresh the report when a selection is made.
To clean up the look of our prompt page, we will add our three prompt objects inside field sets. Field sets can be found in the Toolbox tab of the Insertable Objects pane as shown below.
Double-click the text area of the field set and enter the following text without the double-quotes: “Select a year“. Drag the prompt inside the field set.
Save the report as “Prompt Report” in the “Global Filters” folder.
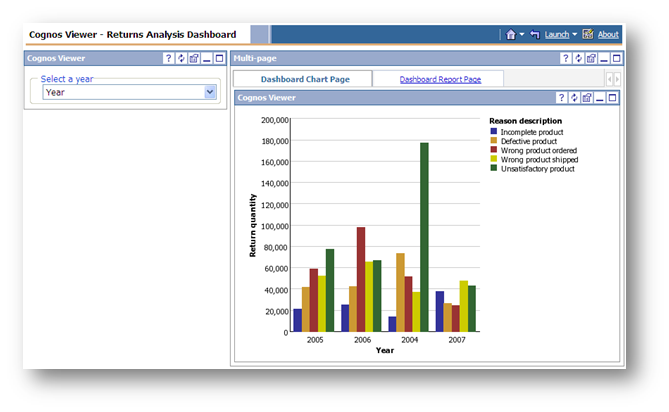
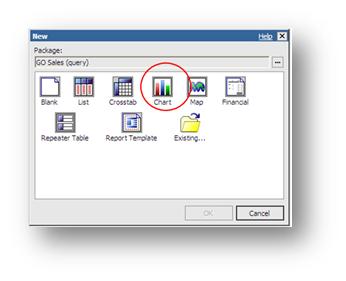
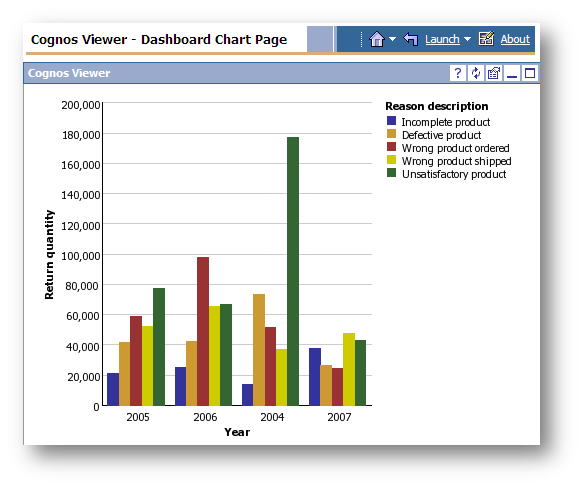
We are now ready to create the outputs for our dashboard. These will consist of one report and one chart. We will begin by creating the chart report. To do this, create a new Report Studio report using the Chart template:
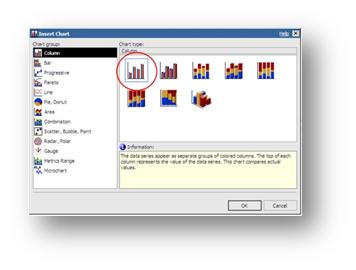
When prompted to select a chart, keep the default selection and click OK.
Drag the following package items to the following chart drop zones:
  • Default measure: [Returned items (query)] > [Returned items] > [Return quantity].
  • Categories: [Returned items (query)] > [Time dimension] > [Year].
  • Series: [Returned items (query)] > [Return reason] > [Reason description].
Using the Query Explorer, select to “Query 1″ create the following parameterized filter:
[Year]=?pYear?
Save your report as “Dashboard Chart” in the “Global Filters” folder.
We will now create another Report Studio report, but this time, it will be a crosstab. Click the New button in the toolbar and choose the Crosstab template.
Drag the following package items to the following chart drop zones:
  • Rows: [Returned items (query)] > [Returned items] > [Return quantity].
  • Columns: [Returned items (query)] > [Time dimension] > [Year].
  • Measure: [Returned items (query)] > [Return reason] > [Reason description].
Using the Query Explorer, select to “Query 1″ create the following parameterized filter:
[Year]=?pYear?
Save your report as “Dashboard Report” in the “Global Filters” folder.

Step 2: Create the detail IBM Cognos Connection portal pages

In this step we create portal pages in IBM Cognos Connection to hold each one of the reports created in the previous step.
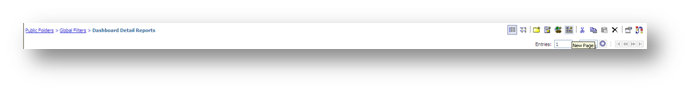
From Cognos Connection, navigate to the “Dashboard Pages” folder and click the New Page button as shown below.
The New page wizard starts. In the Name: box enter “Dashboard Charts Page” and click Next.
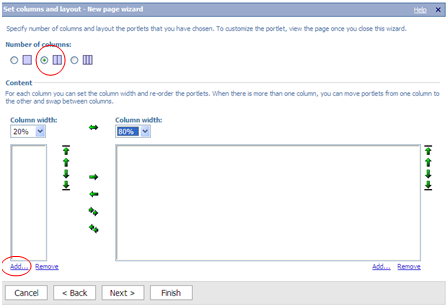
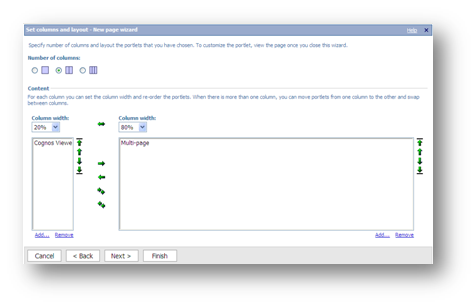
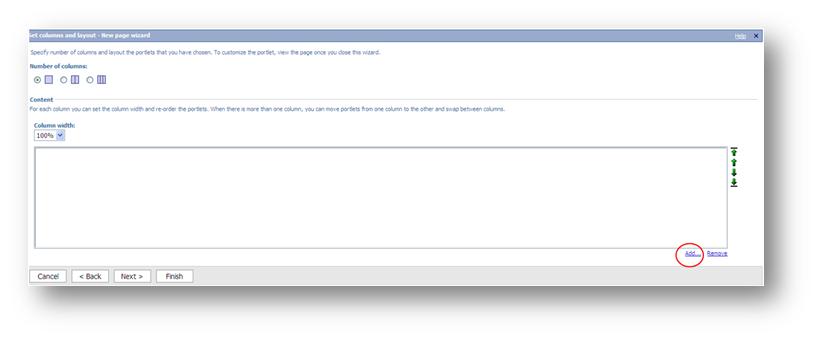
From the Set columns and layout window, keep the default number of columns and click theAdd… button at the bottom to add an object to the page.
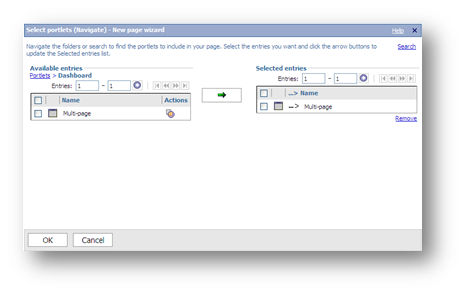
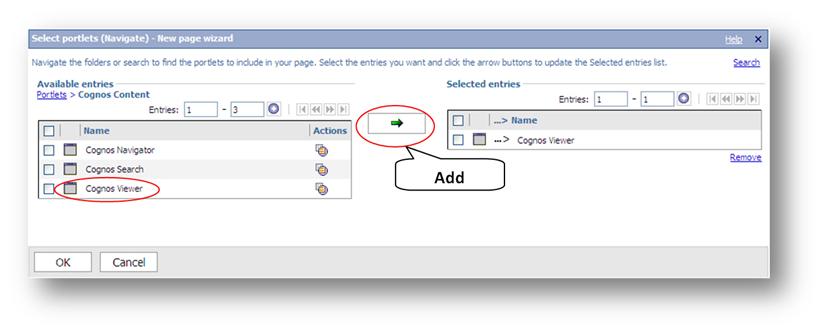
In the Select portlets (Navigate) section of the wizard, click Cognos Content in the left page and then add a Cognos Viewer object by checking it in the left pane and then clicking the Add button.
Click OK. This will return you to the “Dashboard Details” folder in Cognos Connection.
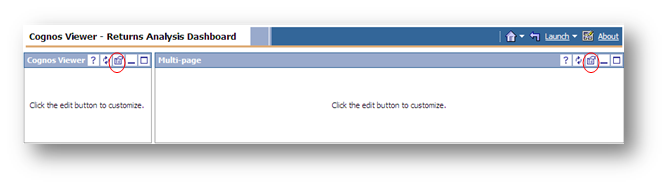
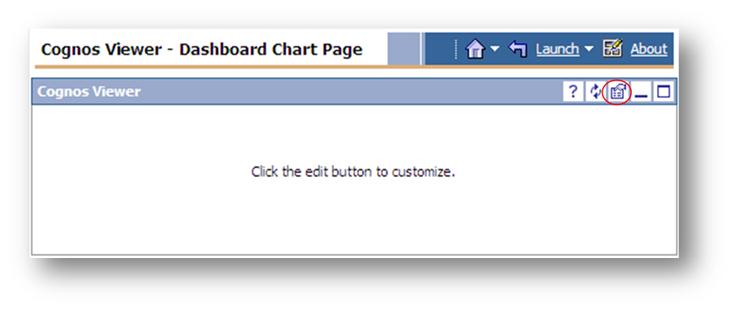
We have created the page and now have to select an entry to run in the page. To do this, click the “Dashboard Chart Page” link to run the page.
We see our empty page. To associate a report with the page, click the Properties button as shown below.
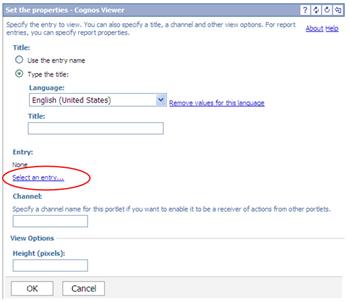
In the properties window, click the Select an entry… link.
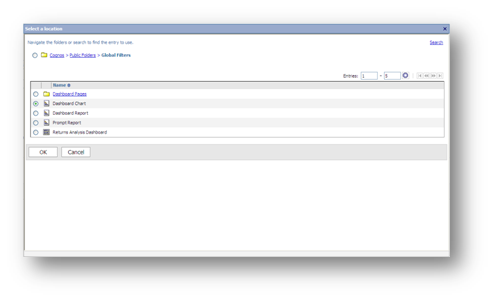
Select the “Dashboard Chart” report and click OK.
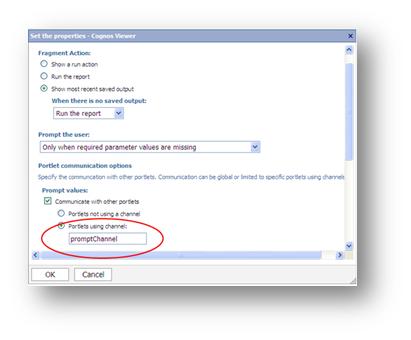
Finally, to establish communication between the various dashboard pages, click the Report Properties link. Look for the Prompt values section and enable Communicate with other portletsoption. Then, select Portlets using channel: and type “promptChannel” (without the double-quotes) in the text box as shown below.
Click OK twice. The chart is displayed.
Repeat the previous steps to create the “Dashboard Report Page” that will also reside in the “Dashboard Pages” folder.

How to Create Users & Permissions using Cognos Administration

Cognos Administration allows administrators to create users and set user access level permissions to folder or to a report. You can create permissions to the fellow members if you have the administration access to the cognos administration panel.

The following is the step by step tutorial that helps you in creating a user and also give permissions to that user using cognos administration panel.
  • Now right click on the right top most corner where you have a drop down menu for the different studios. You can click on the launch button and select the administration panel as seen in the below picture.
  •  
  • Now after clicking on that you will be navigated to a window where you have 3 tabs for status, security and configuration. In the configuration window, you can select the installation folder you have used to install and go into it.
  • Now you can view different users with different permissions. You can select any existing user here or you can add a new user to this list and give them the permissions.
  • In this example I have selected the option for  the new user and the options for the corresponding is given in the next window as seen in the picture as shown.
  • You can also select a new group to select from them and the corresponding window as seen.
  • After selecting the user or adding the user you can give some permissions depending upon the requirements.  You will given with a window Where you have permissions tab as one among the three.
  • Now, select the options you would like to grant the permissions to that individual or to that group. You can give read, write, execute, set policy, Traverse option.
  • Once the permissions are given, you are done with giving the permissions to the user. Now log out of the main account and see if the demo id you using for testing works fine or not.
That's it, you are now a cognos administrator and you can give the permissions to the users you want. But be careful while judging who should be given with what level of access.

COGNOS CONNECTION PPT

CLICK ON IMAGE FOR READING